2026 Outlook Public Equity
Disclaimer: The information and materials prepared are for internal use only and on how the Dancap Family Investment Office (“Dancap”) views current market dynamics. Dancap does not guarantee the accuracy or completeness of the material and it is not intended in any manner to be investment, financial, legal, accounting, tax or other advice and should not be relied upon.
Dancap's Public Equity Markets Outlook
June, 2026
Dancap has a significant track record of investing in public equity strategies through third-party managers. Our strategies are actively managed, tax-optimized, and structured as managed accounts that offer daily liquidity and full transparency into underlying holdings. This market overview highlights Dancap’s current public equity strategies by geographic allocation and provides an update on market dynamics, outlook, and risks.
The majority of Dancap’s public equity strategy is allocated to managers specializing in U.S. large-cap stocks. With our strategies held in managed accounts, we monitor holdings and benchmark performance daily against appropriate indices. A smaller portion of our public equity holdings is allocated to third-party managers focusing on non-U.S. large-cap companies with significant long-term growth potential. In all cases, we partner with managers who demonstrate the ability to consistently generate alpha and outperform their respective benchmarks, net of fees. Our strategies aim to deliver minimum net annual returns of 10% on an absolute basis.
United Stages Strategy
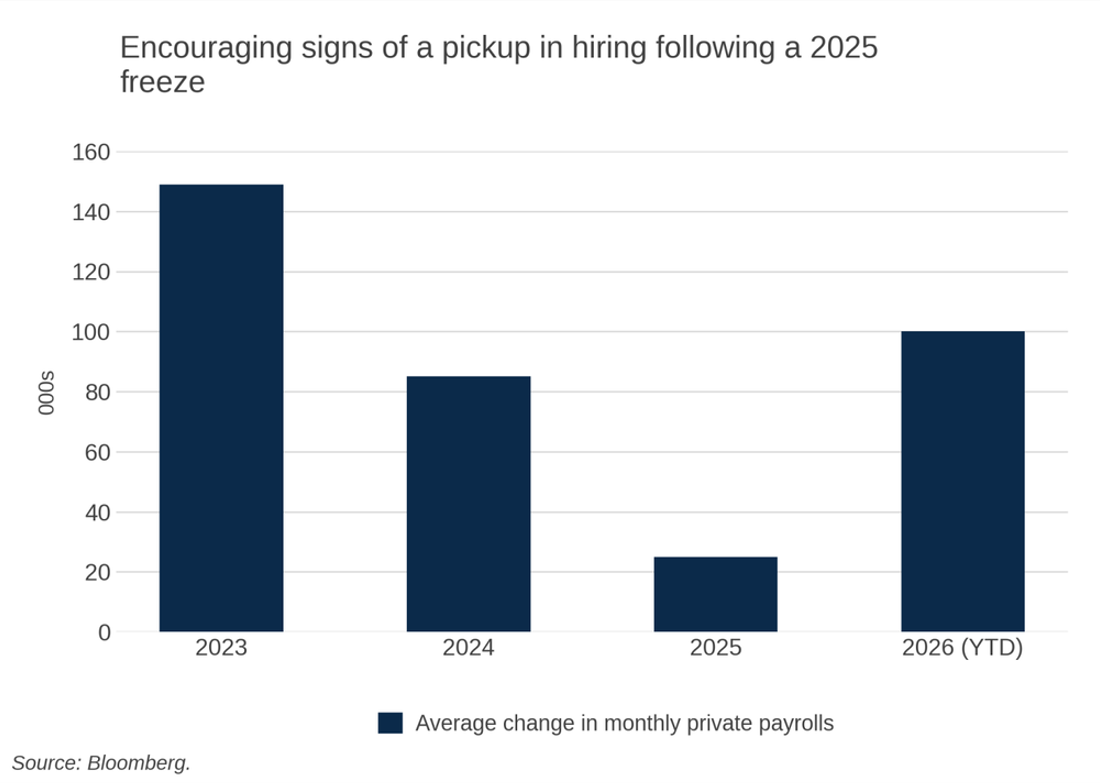
The US labor market entered 2026 as a key area of concern. As shown in the chart below, average monthly private payroll growth slowed sharply from 149k in 2023 and 85k in 2024 to just 25k in 2025, reflecting a hiring slowdown through the back half of last year, a slowdown subsequently confirmed by the BLS’s September 2025 preliminary benchmark revision, which cut 911k jobs from the April 2024 to March 2025 period (the largest downward revision since 2009). The data through end of May 2026, however, suggest that conditions have continued to improve.
Private payroll gains have averaged roughly 100k per month year-to-date, a clear pickup from the 2025 pace. ADP’s May reading of +122k was the largest monthly gain since January 2025, and the BLS has now posted three straight monthly increases in total nonfarm employment. March and April were revised up to +214k and +179k (from +185k and +115k), a combined 93k above prior estimates, and May added +172k. Those upward revisions are themselves notable after the run of downward revisions that characterized 2025. While hiring is still running modestly above the 2024 average and well below the stronger levels of 2023, the rebound meaningfully reduces near-term recession risk. The unemployment rate, which drifted up from 4.0% in January 2025 to a four-year high of 4.5% in November 2025, has since declined to 4.3% and held there through May.
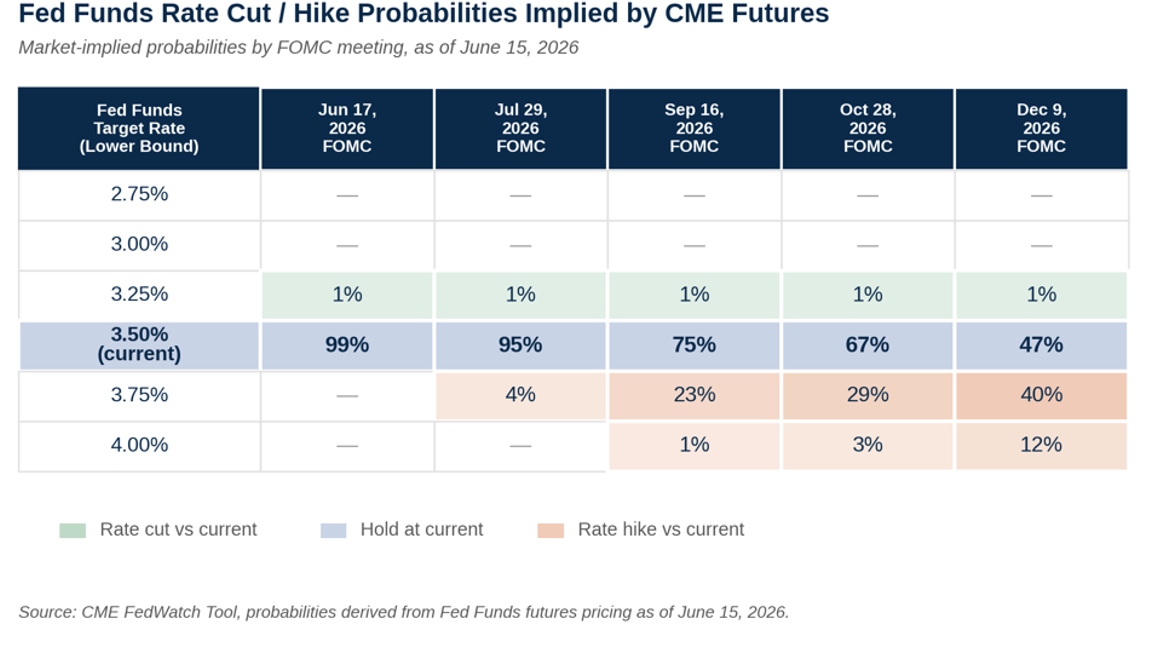
The CME Fed Funds futures market table below shows that the policy debate has shifted from when the Fed will cut to whether it will cut at all. Coming into 2026, the consensus view was for two to three 25 basis point rate cuts over the course of the year, taking the Fed Funds rate down to 2.75% or 3.00% at the lower end of the range. Goldman Sachs expected the Fed to pause in January before delivering cuts in March and June, while futures markets at the start of the year were pricing in roughly 50 basis points of total easing. The Fed’s own December 2025 dot plot called for one cut.
However, over the course of 2026 so far, consumer prices, as measured by the CPI, have remained elevated, rising 4.2% year over year in May, the highest level since April 2023. As of June 15, 2026, markets expect the Fed to keep interest rates on hold for the remainder of the year, assigning a 47% probability of doing so, and if anything expect the Fed to raise rates by 25 basis points (40% probability) rather than cut them (only a 1% probability). For public equity markets, the implication is that lower interest rates are likely no longer a tailwind that will cause forward P/E multiples to expand through the course of the year. With inflation expected to remain elevated over the remainder of 2026, there is the possibility we see higher interest rates, as supported by the table above, which could lead to lower forward P/E multiples over the course of the year.
A market correction remains a key risk and could be triggered by a reversal in AI sentiment. The Magnificent 7, consisting of Apple, Microsoft, Alphabet, Amazon, Meta, NVIDIA and Tesla, now represent about one-third of the S&P 500’s market capitalization, nearly triple their 12% weight a decade ago, and accounted for 42% of the S&P 500’s total return in 2025. This level of concentration leaves the broader market more exposed to any disappointment in AI-linked earnings expectations. To date, strong technology earnings growth has helped support this concentration, and some analysts note that the Magnificent 7 valuation premium versus the broader market has compressed from more than 70% in 2023 to roughly 30% in 2026. However, AI-related capital spending is rising quickly, from US$410B in 2025 to US$725B in 2026, and will need to translate into stronger revenue and earnings growth to sustain current momentum. If that spending fails to generate sufficient returns, investors may reassess the premium valuation assigned to AI-linked stocks.
United States Outlook
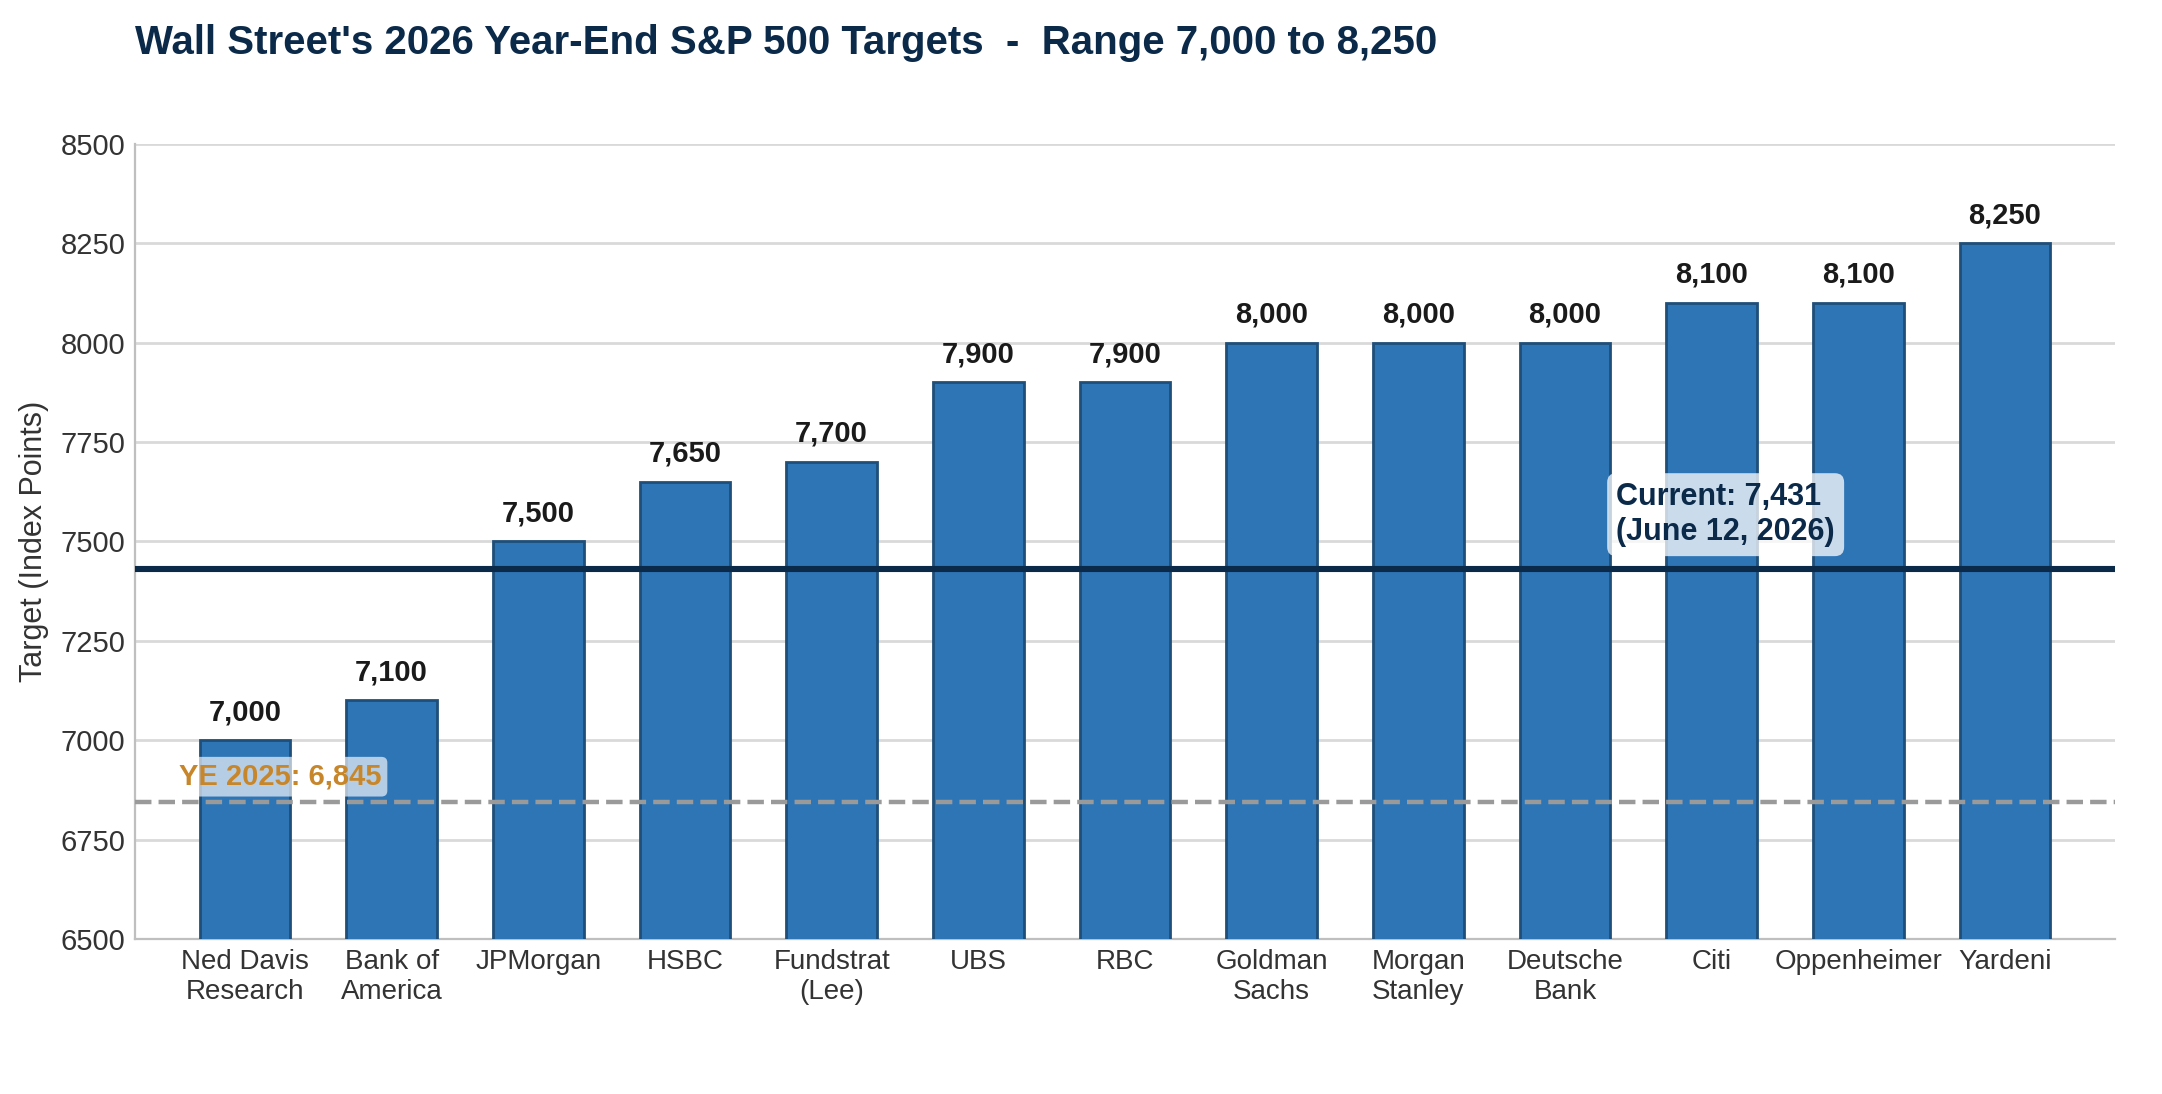
Wall Street remains broadly optimistic on U.S. equities for 2026 despite fading prospects for Fed rate cuts. The S&P 500 ended 2025 at 6,845 (+16% total return) and is trading near its all time highs at just over 7,500 as of mid June. A continued advance from here would put 2026 on track for a fourth consecutive year of double-digit gains, something not seen since the 1995 to 1999 dot-com era. Analysts expect 2026 returns to be driven primarily by earnings rather than multiple expansion: full-year 2026 EPS is now expected to grow about 23% off a 2025 base of roughly $269, an upward revision from the mid-teens growth penciled in at the start of the year, while the forward P/E has compressed from 22x at the end of 2025 to about 20x as earnings estimates have risen faster than prices.
Strong earnings continue to do the heavy lifting. Q1 2026 delivered 28% year-over-year EPS growth, the strongest since Q4 2021, with 84% of companies beating estimates, the highest beat rate since Q2 2021 and well above both the 5-year and 10-year averages. Net profit margins reached 13.4%, the highest level since FactSet began tracking the metric in 2009, led by Information Technology at 29%, up from 25% a year earlier. The forward 12-month P/E now sits at about 20x, roughly in line with the 5-year average, and only modestly above the 10-year average of 19x, having de-rated as profits outpaced prices.
Source: Various Investment Bank Research Outlooks
European Outlook
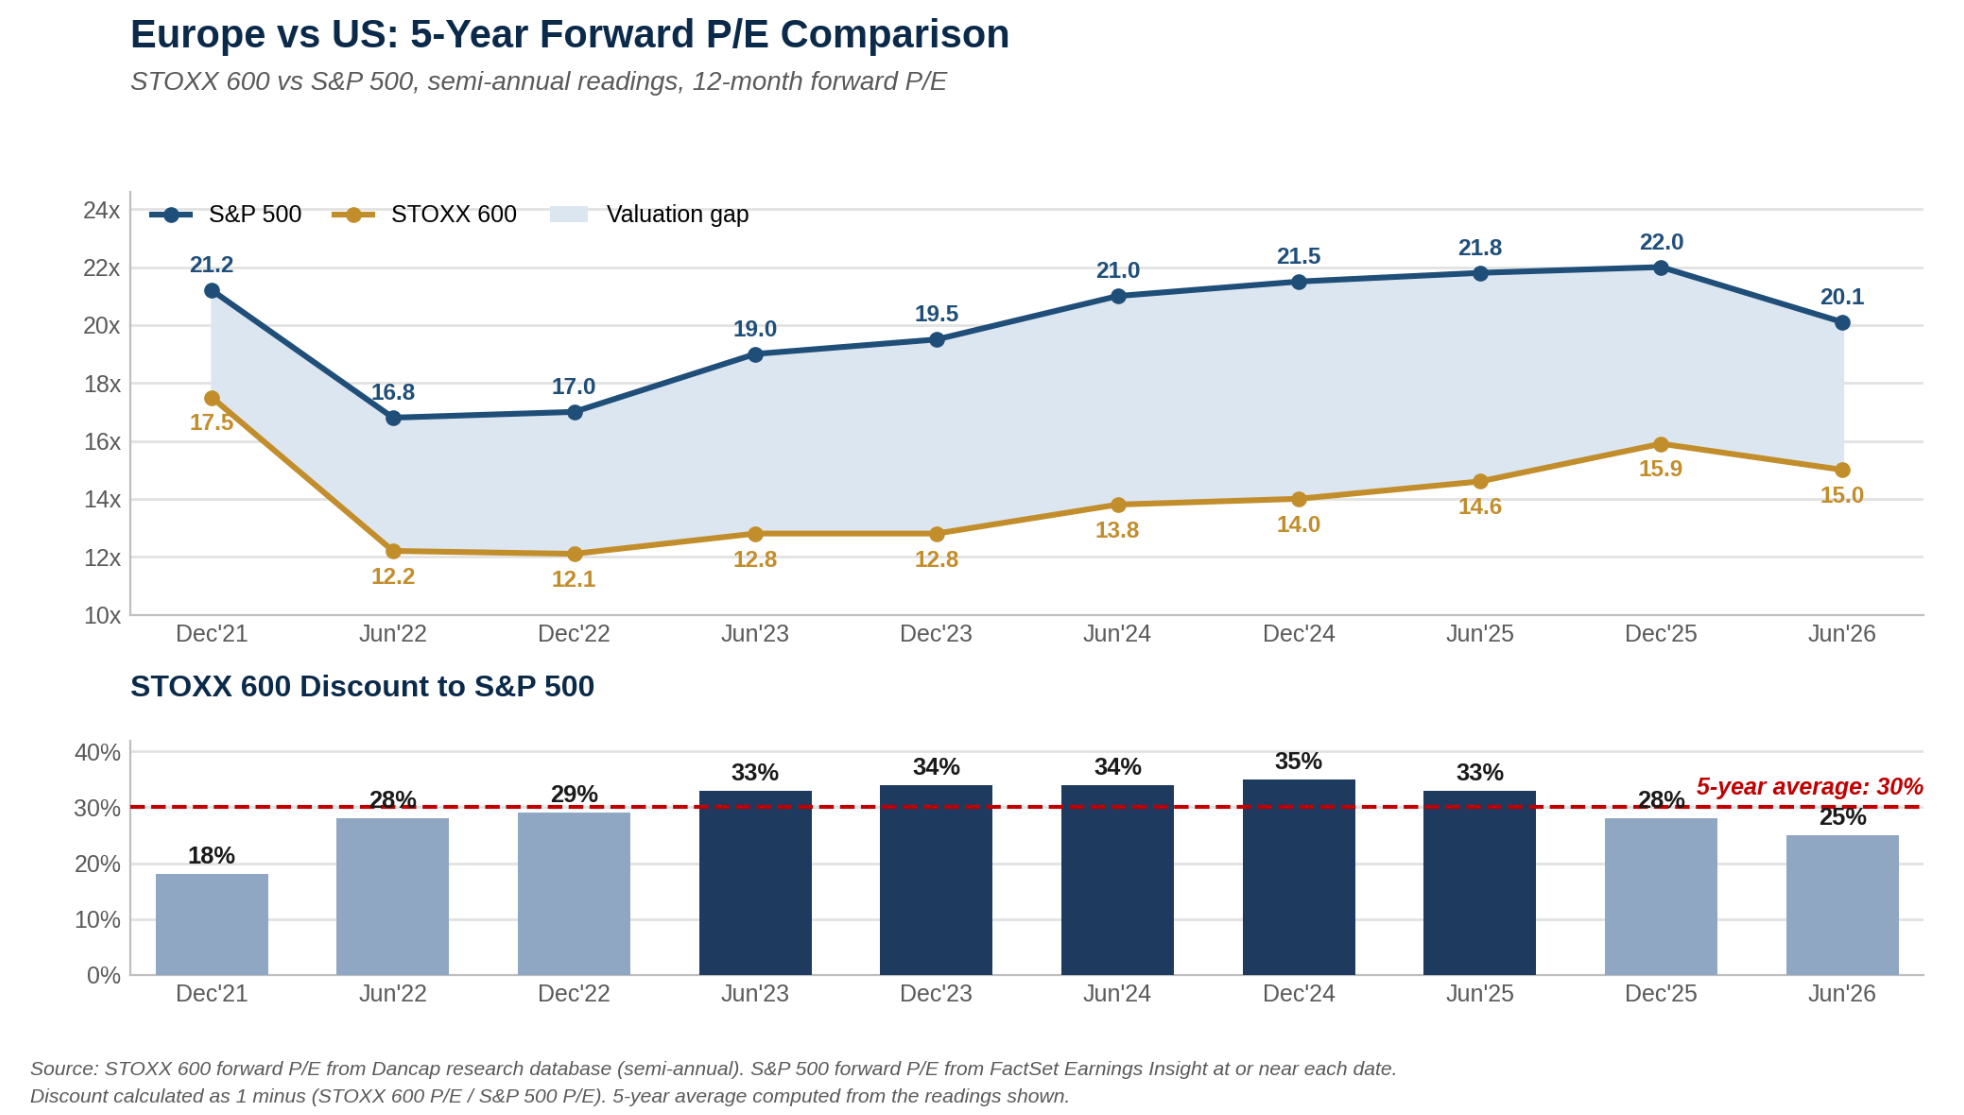
Goldman Sachs Research expects the STOXX 600 to generate a total return of 8% in 2026, supported by EPS growth of 5% in 2026 and 7% in 2027. European banks and financial services companies to outperform, supported by deregulation, M&A activity, and a recovery in primary market activity. Goldman also argues European public equities continue to trade at a meaningful discount to U.S. equities on forward P/E multiples, although the gap has narrowed since the spring. As of the June 12 close, the S&P 500 trades at about 20x forward earnings versus 15x for the STOXX 600, a discount of about 25%. That places the discount modestly below its 5-year average of 30% and well off the 35% peak reached at the end of 2024. The 18% discount seen at the end of 2021, as shown in the table below, predated the AI-led re-rating of U.S. mega-cap technology, when the S&P 500’s information technology sector traded at a forward P/E in the low 20s, compared with more than 30x today.
Should AI-driven multiple expansion in the U.S. fade, or the structural catalysts supporting European equities continue to feed through, the valuation gap could narrow further from here. European stocks remain inexpensive relative to U.S. peers, largely because of the U.S. market’s heavier weighting toward higher-multiple technology companies. According to Goldman, while the gap is partly structural and unlikely to close entirely, the spread, even after the recent narrowing, continues to support a relative value case for maintaining an allocation to European equities.
To see the Dancap Public Equity Investment Criteria and Portfolio, please click here.