2026 Outlook Private Equity
Disclaimer: The information and materials prepared are for internal use only and on how the Dancap Family Investment Office (“Dancap”) views current market dynamics. Dancap does not guarantee the accuracy or completeness of the material and it is not intended in any manner to be investment, financial, legal, accounting, tax or other advice and should not be relied upon.
Dancap's Current Private Equity Strategy
June, 2026
Dancap has more than 30 years of experience investing in private equity through third-party funds, co-investments, and direct investments. Our private equity portfolio is diversified across strategies and geographies, with a primary focus on U.S. buyout and, to a lesser extent, secondaries and expansion capital. We invest in managers with proven track records across multiple market cycles, consistent teams, and repeatable strategies, with a preference for buyout managers acquiring control positions with a defined exit path. This market overview reflects our current dynamics, outlook, and risks as they relate to Dancap’s private equity portfolio positioning. The underperformance of private equity occurred more recently and the outperformance against other benchmarks remains. We also note that there have been other times over the last 25 years where the 10-year period showed underperformance on the private side: 2011 and 2019. Both periods were followed by strong outperformance.
Buyout Strategy
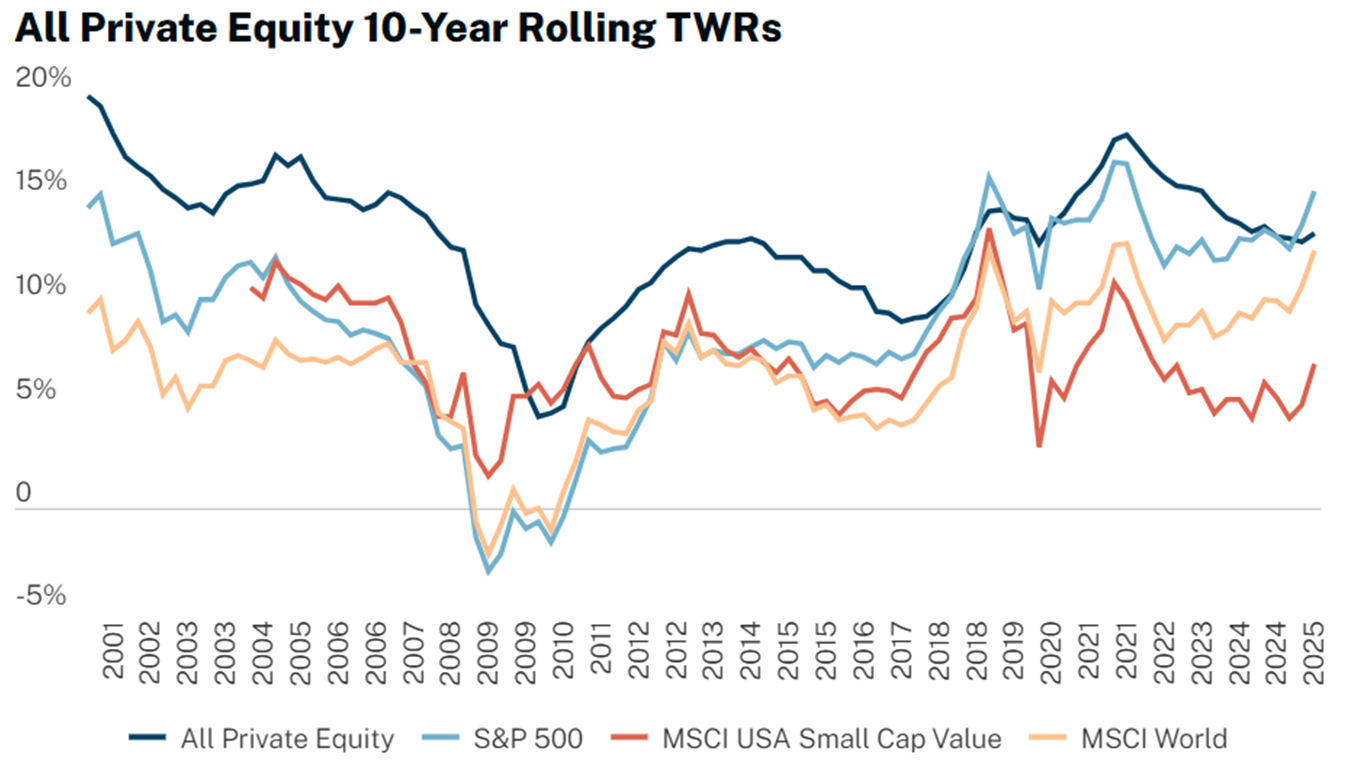
Recent relative underperformance in private equity buyout versus public equities should be viewed in the context of longer-term private equity cycles. Investors will want to consider whether recent weakness reflects a cyclical period of underperformance rather than a structural change in the private equity return opportunity, particularly given that prior periods of weaker relative performance have often been followed by periods of higher returns. While the chart below reflects all private equity rather than buyout alone, it provides useful context for buyout investors, as buyout remains the largest component of the private equity asset class. Hamilton Lane’s 10-year rolling return data suggests that private equity’s relative performance versus the S&P 500 has moved in cycles. In the latest period shown, all private equity generated an estimated 10-year rolling return of approximately 12% to 13%, compared with approximately 14% to 15% for the S&P 500, implying a current return spread of roughly negative 200 basis points versus the S&P 500.
That current shortfall should be considered in a broader historical context. The chart shows that private equity has often outperformed public equities over 10-year periods, particularly around and after periods of public market stress. In 2009, for example, the S&P 500’s 10-year rolling return was approximately negative 4%, while private equity was closer to positive 4%, implying a positive relative spread of roughly 800 basis points. Private equity’s 10-year rolling return then improved to approximately 12% by 2013-2014 and later reached roughly 17% by 2021.
Source: Hamilton Lane; 2026 Markets Overview
For buyout investors, the key consideration is whether today’s approximately 200 basis point performance shortfall versus the S&P 500 reflects a cyclical period of underperformance, particularly against a backdrop of unusually strong public equity returns concentrated in large-cap technology and AI-related stocks, or a more durable shift in the relative return opportunity.
Buyout Outlook
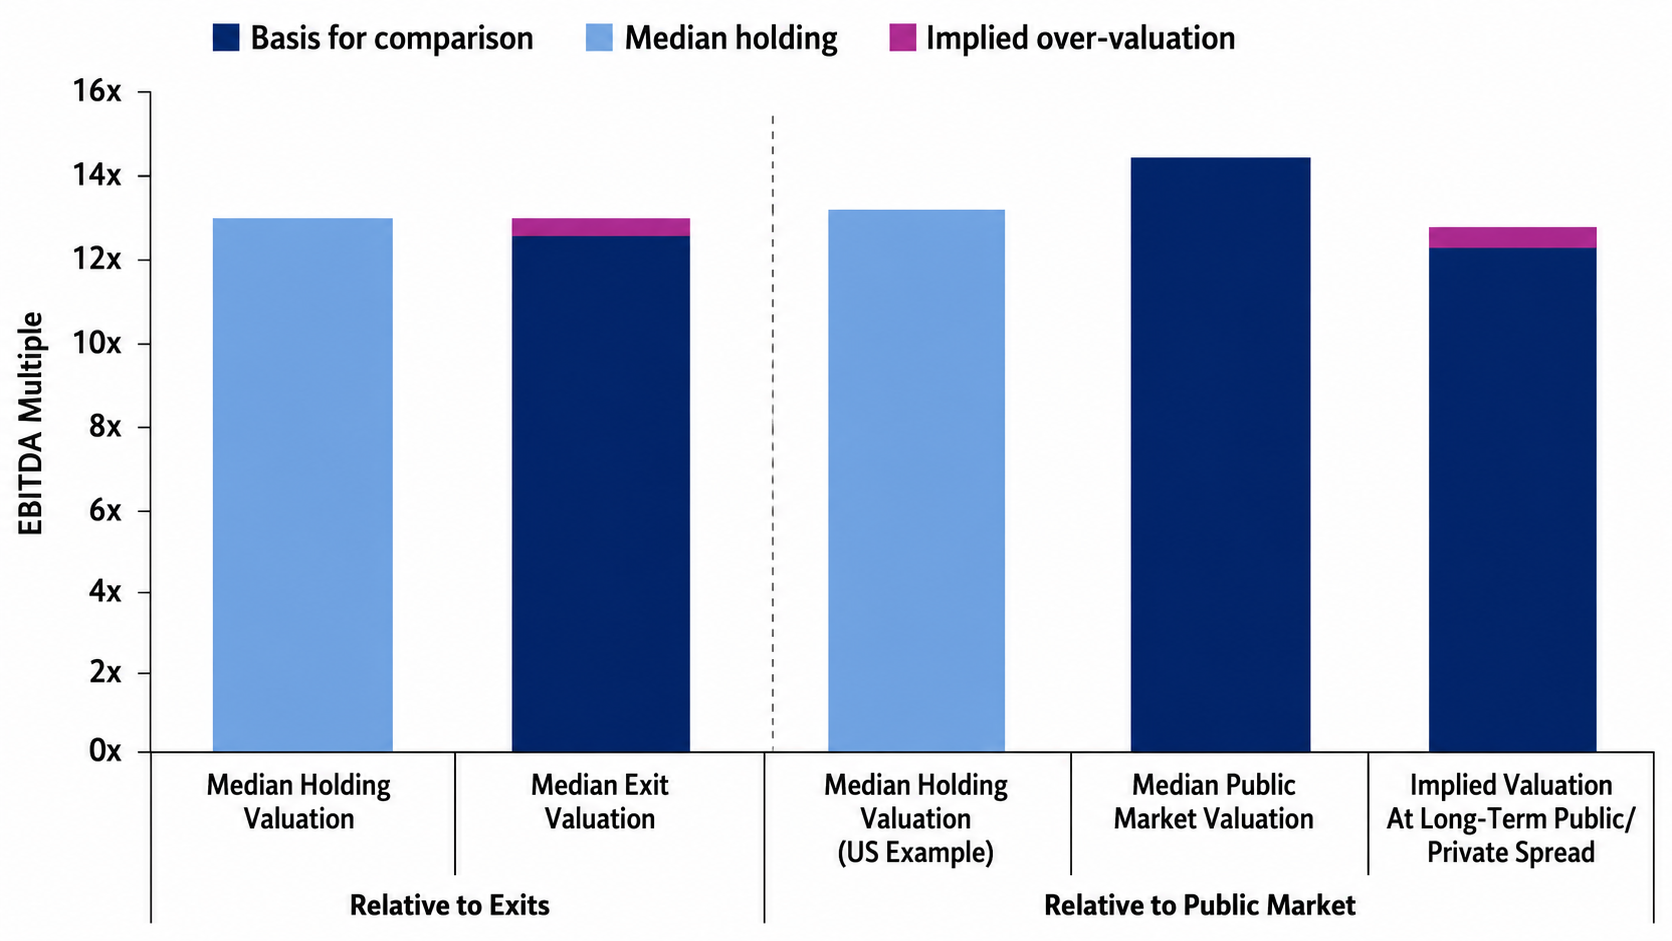
According to Goldman Sachs, current buyout valuations appear elevated, but are not disconnected from fundamentals. Median buyout holding and exit valuations both reached record highs in 2Q 2025, while the private market valuation discount to public markets is now slightly smaller than its long-term average. That suggests less room for return generation through multiple expansion, particularly with both public and private market valuations already at elevated levels. For buyout investors, the implication is that future returns will likely depend more heavily on company-level growth and operational execution. Goldman estimates that achieving historical private equity return targets of net 2.0x MOIC over five years may now require approximately 10% to 15% annualized EBITDA growth, above long-term averages, with revenue growth likely needing to approach 9% to 10% versus historical experience of roughly 7% to 9%. This reinforces the importance of entry valuation discipline, sector selection, margin improvement and manager-level value creation. In this higher interest rate environment, investors may want to focus less on broad market beta and more on whether managers can generate repeatable operating alpha across specific companies and sectors.
Source: Goldman Sachs; Exploring Alternative Dimensions Across Private Markets in 2026.
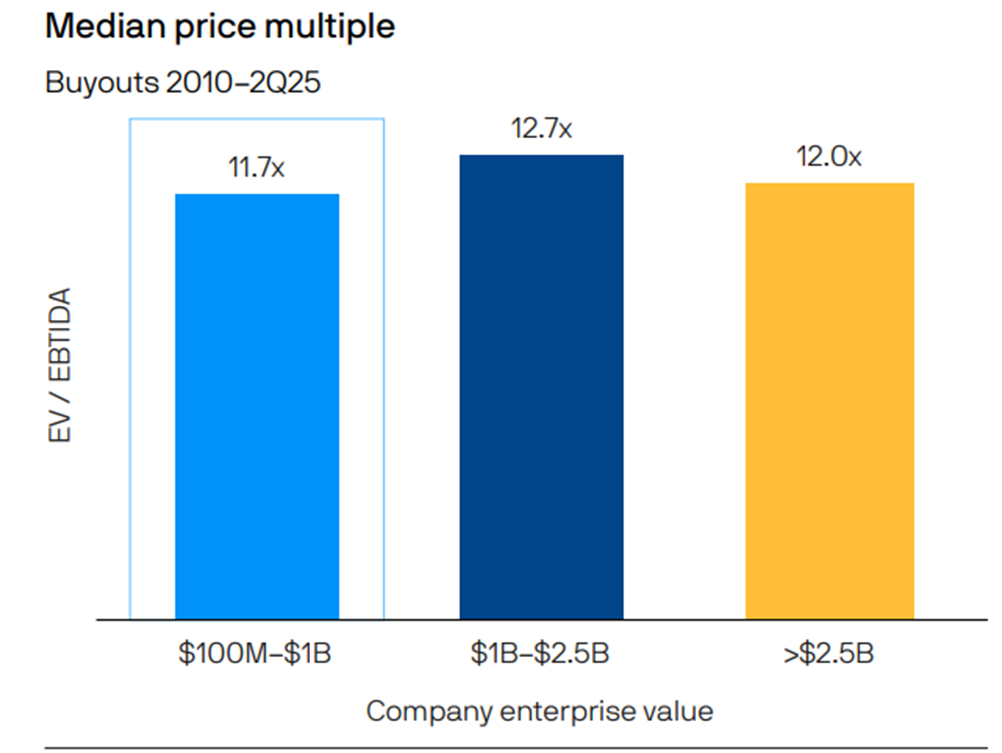
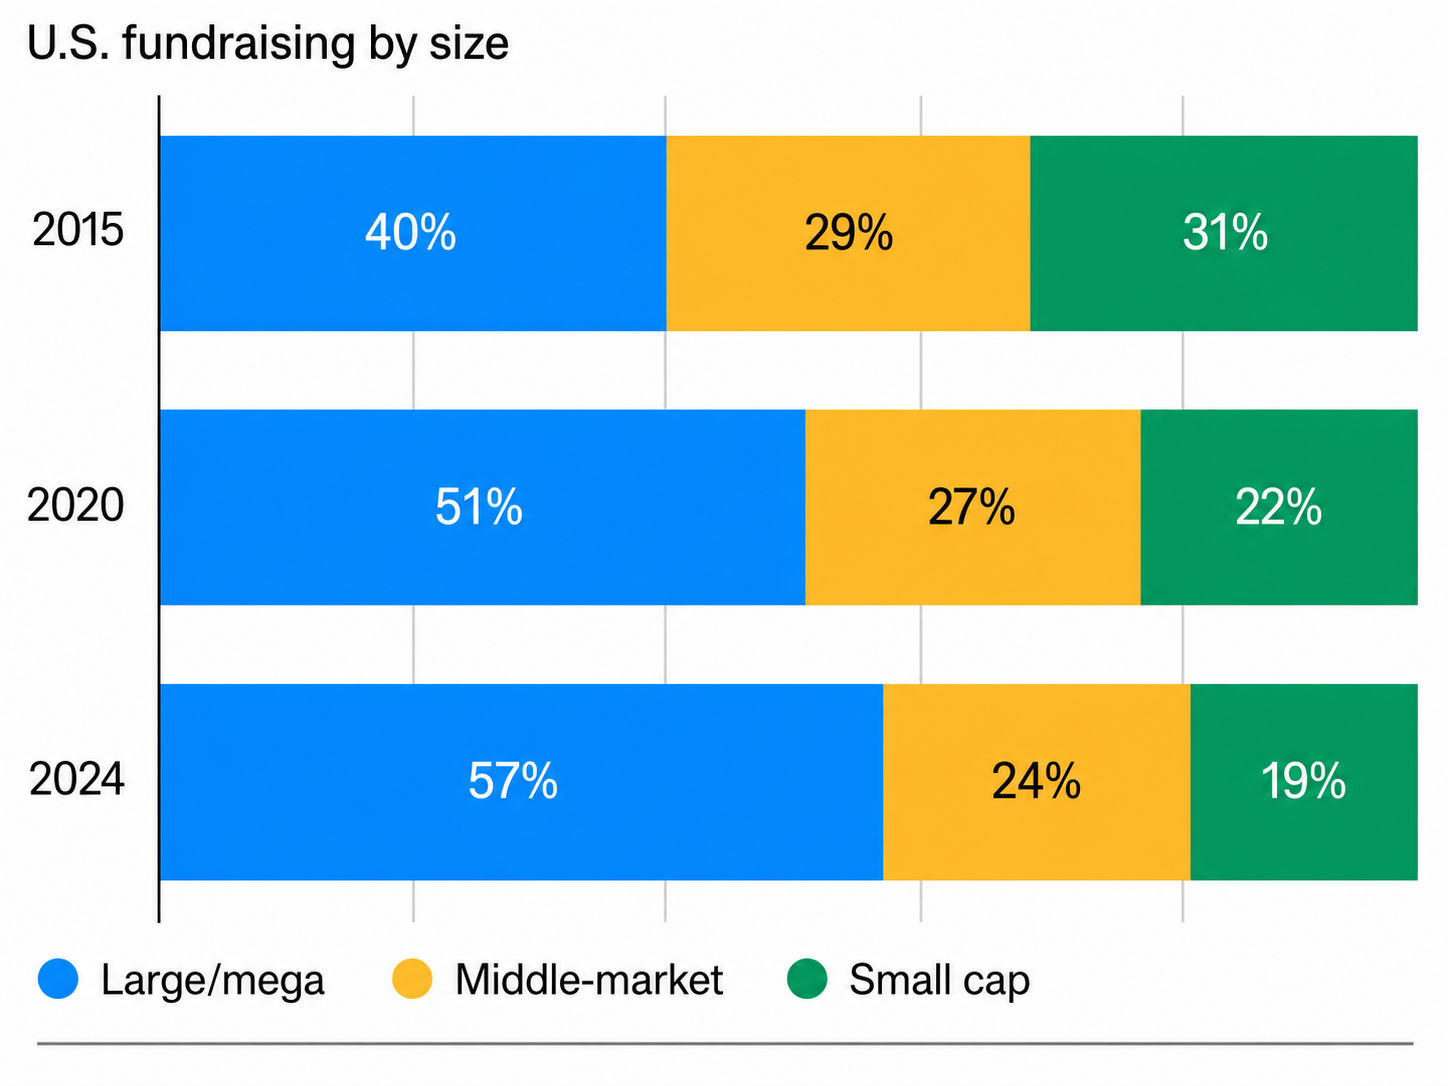
Within buyout, investors may want to pay attention to the middle-market segment, where pricing, liquidity and value-creation dynamics can differ meaningfully from large-cap private equity. The data below from J.P. Morgan indicates that middle-market buyout deals have recently transacted at a median 11.7x EV/EBITDA, compared with 12.7x for larger buyouts. Lower entry multiple can matter, particularly in an environment where multiple expansion may be less likely and future returns will need to come from revenue growth and margin expansion. The fundraising data below also suggests that capital has continued to concentrate in large and mega-cap funds. Large and mega funds represented approximately 40% of U.S. fundraising in 2015, rising to 51% in 2020 and 57% in 2024. Over the same period, middle-market funds declined from roughly 29% to 24%, while small-cap funds declined from 31% to 19%. This shift may create a more attractive relative opportunity for investors focused below the largest end of the market, where there may be less capital crowding, more fragmented ownership, and greater scope for professionalization, operational improvement and strategic M&A.
Source: JP Morgan Alternative Investments Outlook 2026
For Dancap, this supports a continued focus on middle-market buyout funds, particularly managers in the $1B to $3B fund-size range. This segment of the market can provide exposure to companies that are large enough to have institutional quality, but still small enough for hands-on ownership to influence outcomes. Investors should consider whether managers in this part of the market can combine entry valuation discipline with repeatable value creation, rather than relying primarily on leverage or market multiple expansion.
Secondaries Strategy
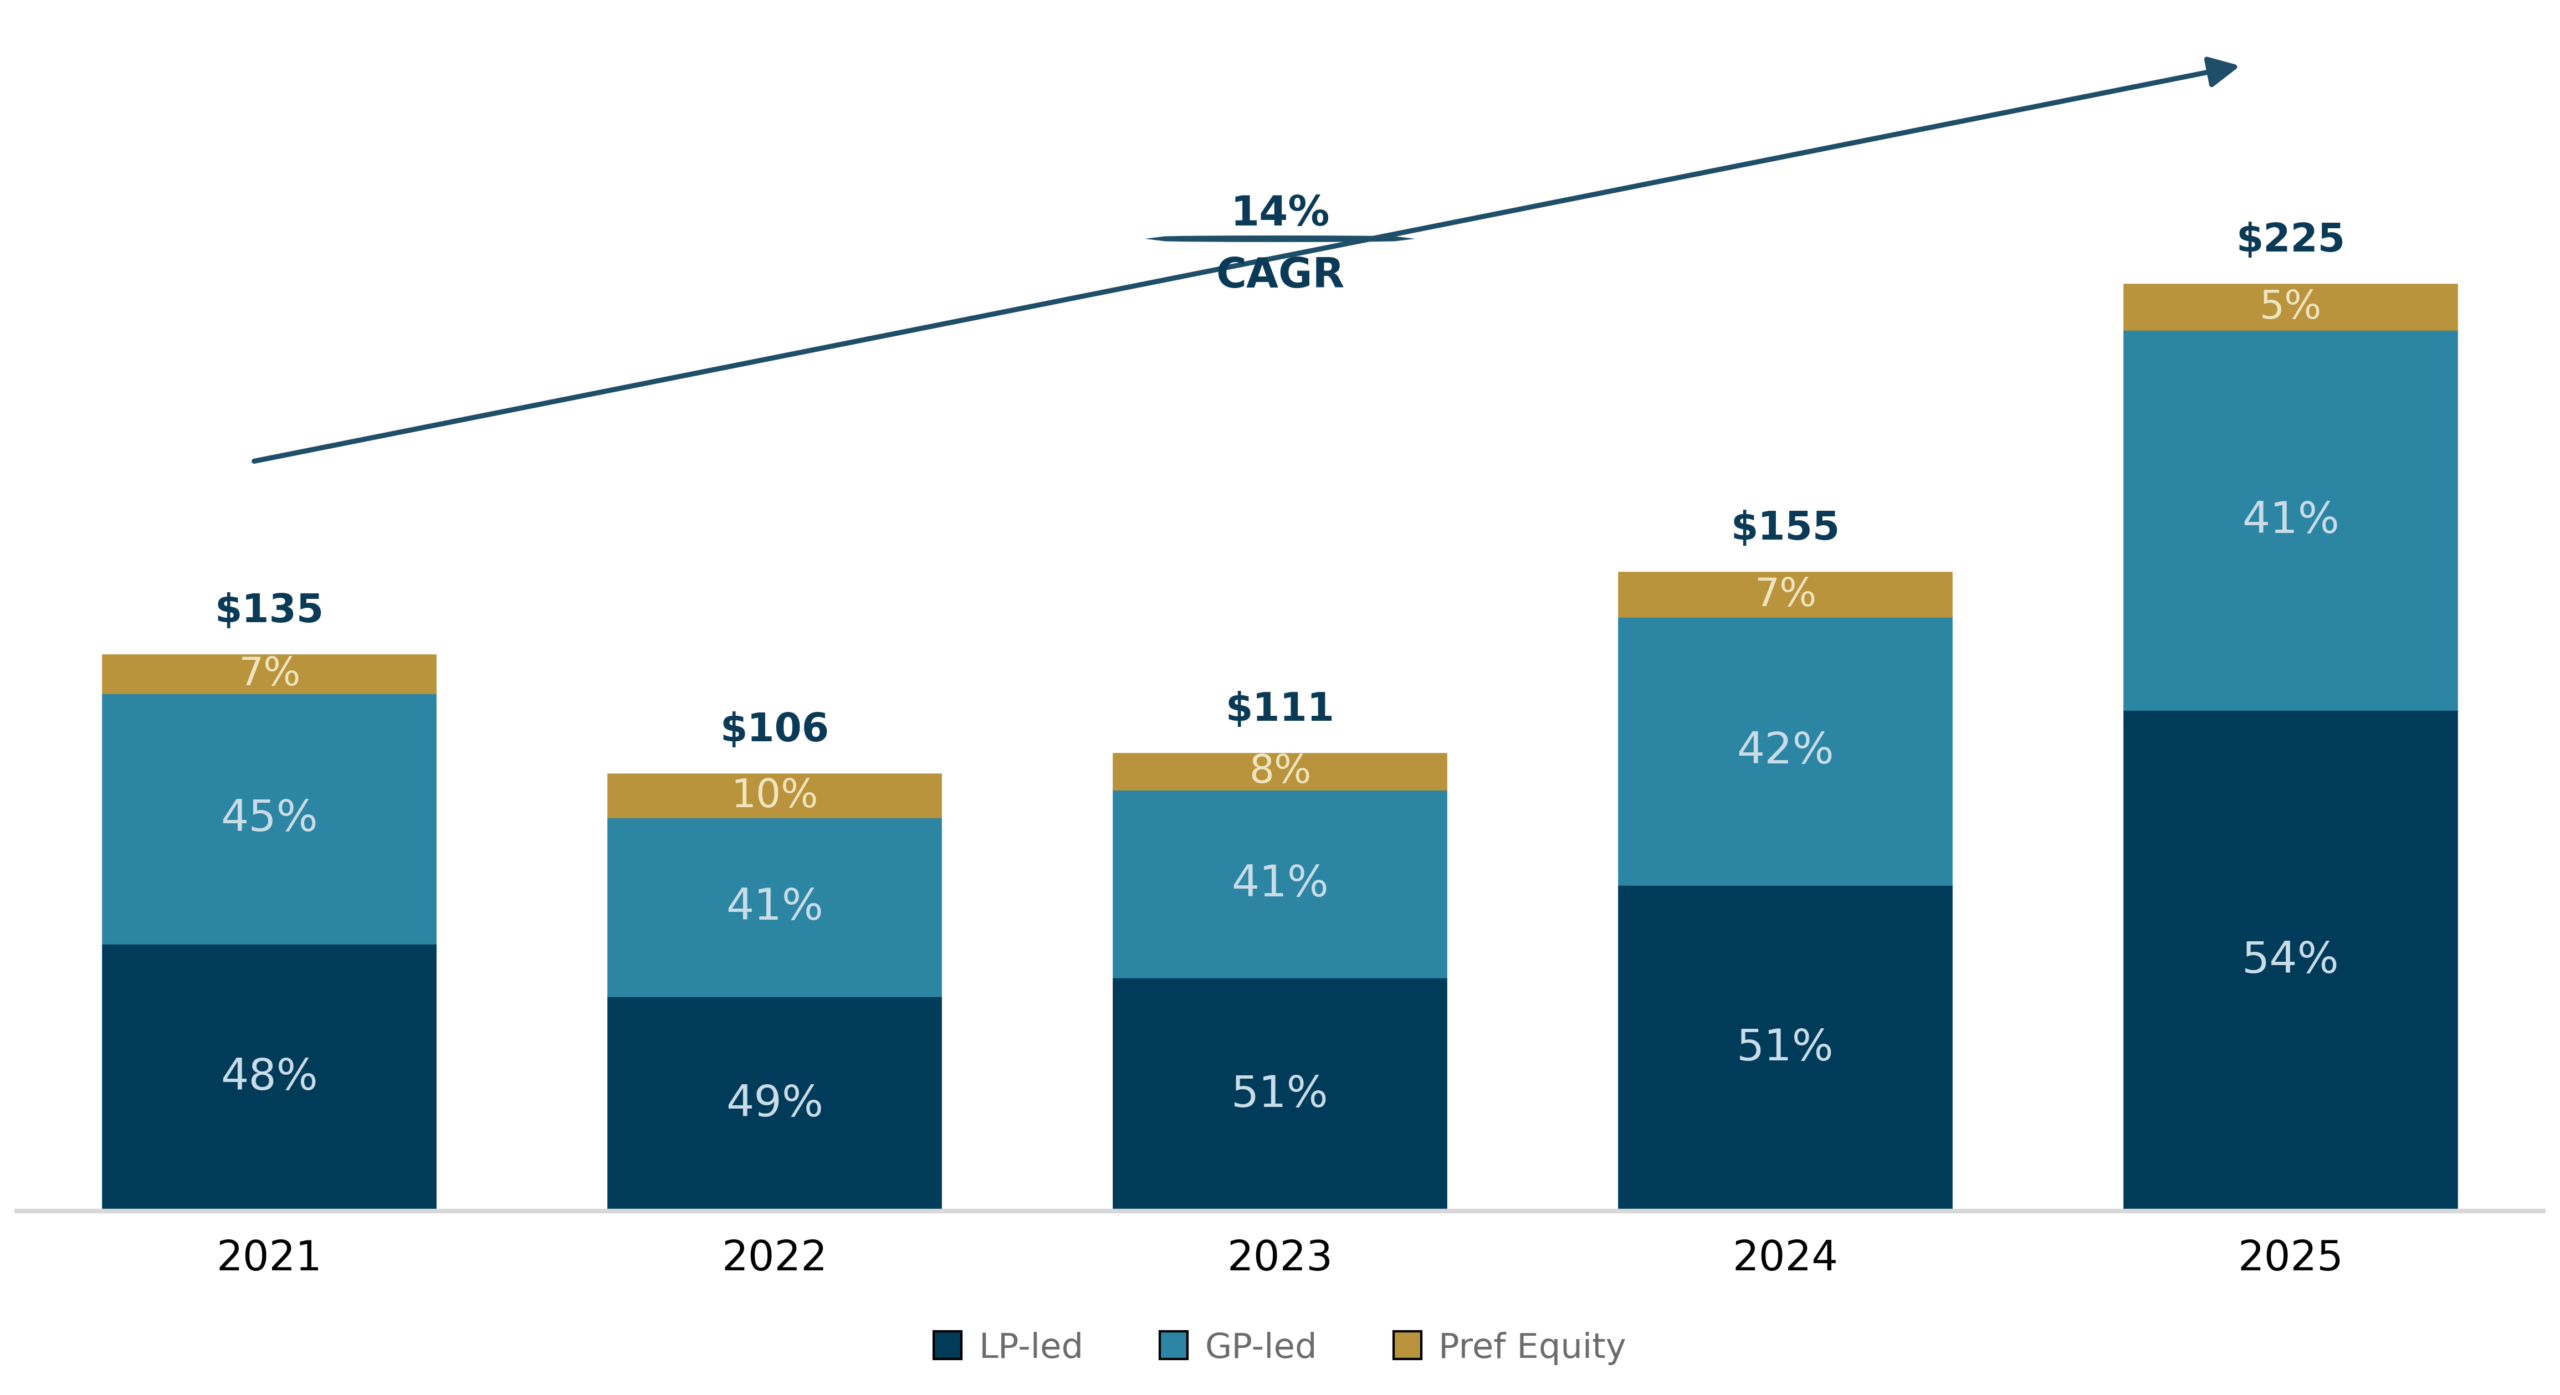
The private equity secondary market continues to expand at a strong pace, with global volumes reaching $225B in 2025, up 45% year-over-year from 2024, according to Campbell Lutyens. During 2025, LP-led transactions represented 54% of activity, as liquidity-constrained investors rebalanced portfolios and freed capital for new commitments. GP-led transactions made up 41% of deal flow, reflecting the mainstream use of continuation vehicles as sponsors look to extend ownership of trophy assets and provide distributions in a muted exit environment. According to research from Jefferies, single-asset continuation vehicles remain the most active form of GP-led secondary solutions, with concentrated buyer demand supporting pricing at or above par for a majority of deals. Multi-asset CVs and are also gaining share, providing diversification opportunities for buyers.
Source: Campbell Lutyens H2 2025 Secondary Market Overview Report
Secondary funds continue to offer an attractive risk-return profile. By mitigating the J-curve effect and providing access to diversified pools of assets, secondary funds have proven their strategy in a rapidly changing market environment. Favorable pricing opportunities, including discounts on assets driven by liquidity pressures, further enhance the appeal of secondary investments in today’s environment. Investors seeking to capitalize on the opportunities within this space may want to focus on managers with strong expertise in both traditional LP-led and GP-led transactions.
Secondary Outlook
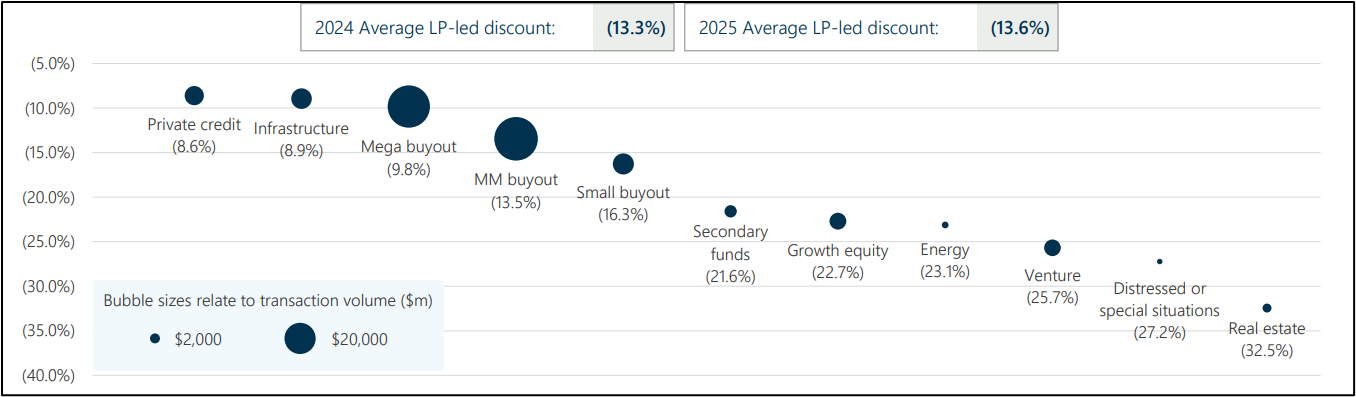
The outlook for private equity secondaries remains constructive, supported by resilient pricing and strong capital formation. According to Campbell Lutyens, LP-led transactions priced at 87% of NAV in 2025, essentially unchanged from 2024 levels despite record supply, with mid and large market buyout funds trading at average discounts in the 10% to 13% range, broadly in line with long-term norms. Research from Jefferies notes that more than half of GP-led transactions are now selling at or above par, led by single-asset continuation vehicles, reflecting both heightened competition and ample capital looking to be put to work.
Source: Campbell Lutyens H2 2025 Secondary Market Overview Report
Strong secondaries fundraising continues to support market activity, with Campbell Lutyens reporting $107B raised for secondary strategies in 2025, up 32% from 2024, and an estimated $130B to $145B targeted for 2026. Secondary evergreen vehicles have also become a larger source of demand, raising $33B in 2025 and $100B to date, with more than 60% of that capital allocated or earmarked for secondaries. With supply elevated, pricing broadly resilient and buyer capital expanding, the secondary market remains a critical liquidity outlet in private equity, providing LPs and GPs with an increasingly important path to distributions and exits.
Dancap's Current Expansion Capital Strategy
A small portion of Dancap’s private equity portfolio is allocated to managers who invest in private companies seeking capital to sustain or accelerate growth ahead of a potential sale or IPO. Dancap looks to partner with managers targeting scalable businesses with proven products, clear customer adoption, line of sight to at least US $10M in annual recurring revenue within 12 to 18 months, and a clear path to exit within five years. Our managers in this space have very deep track records, consistent teams, and sector-specific expertise, focusing either on earlier-stage institutional rounds or on later-stage companies that are approaching IPO, rather than pursuing both strategies. Dancap targets returns of at least net 25% IRR and 2.5x MOIC for these types of investments.
Expansion Capital Strategy
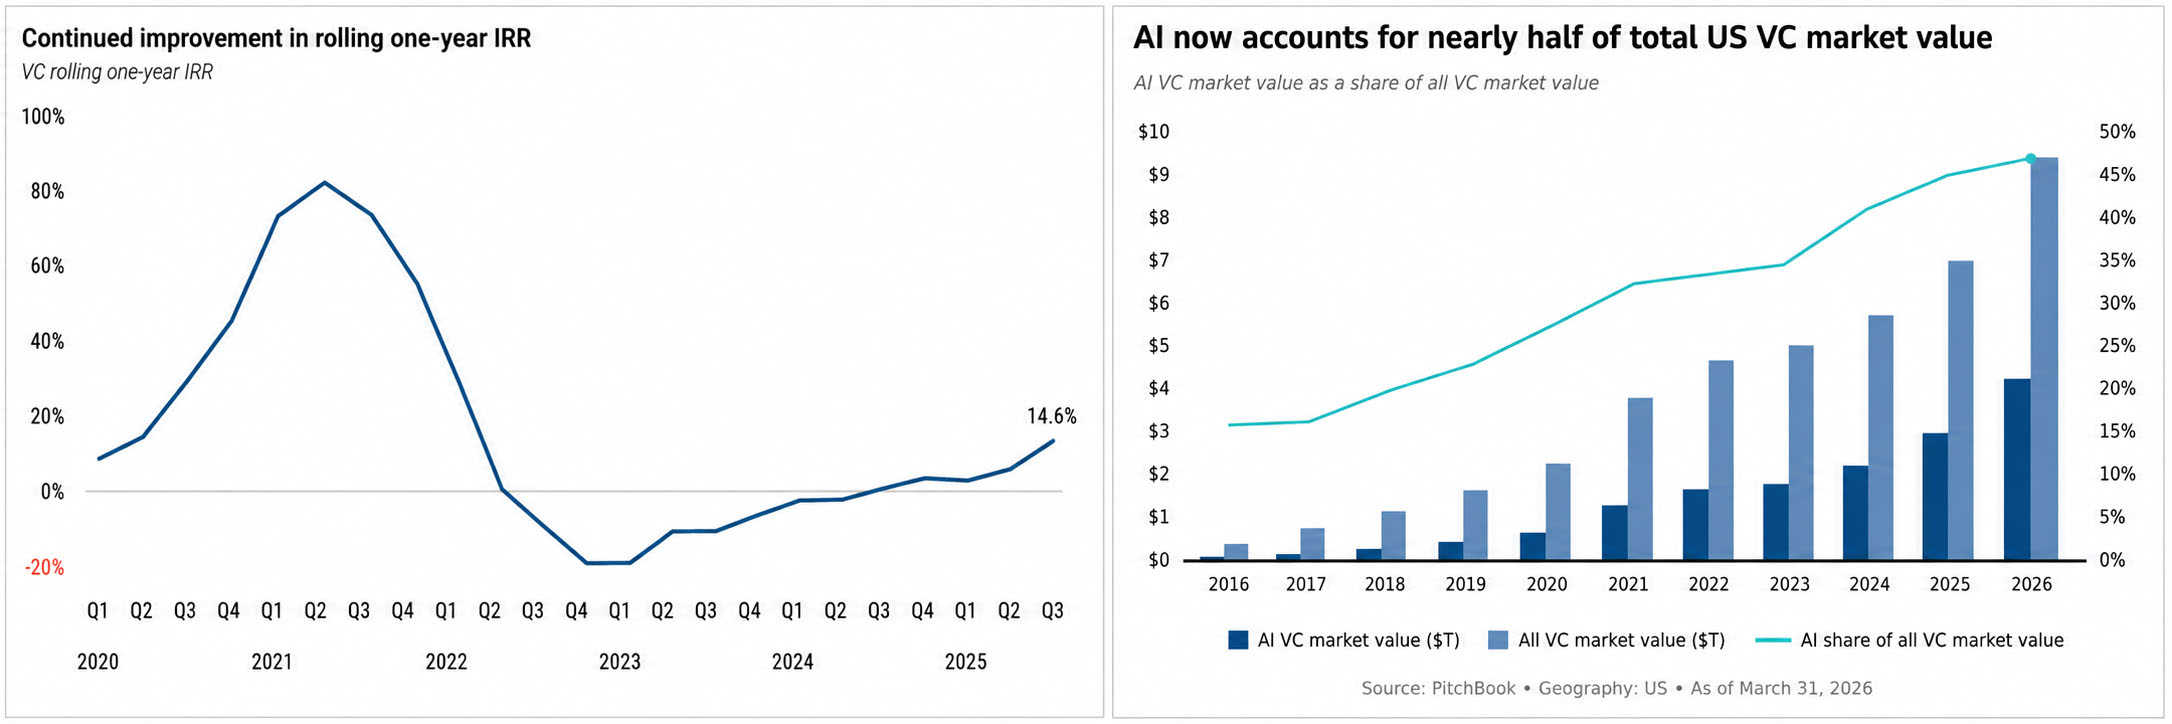
Long-term data continues to support expansion capital’s role as a high-returning asset class, even as the near-term environment has become more selective. Performance has improved meaningfully since 2023, with the rolling one-year IRR now at almost 15% as of Q3 25, the fifth consecutive quarter of increasing returns The upside profile remains attractive in today’s environment, where substantial value continues to accumulate inside private companies: US market value reached $9.4 trillion in Q1 2026, with unicorns alone accounting for over $5.8 trillion.
Source: Pitchbook Q1 2026 US VC Valuations and Returns Report
From a tactical perspective, current market dynamics favor disciplined and highly selective investors. Capital is increasingly concentrated in fewer companies at higher valuations, with median Series A pre-money valuations reaching $62M and Series C reaching $579M in Q1 2026, roughly triple the levels of 2020. AI companies command a substantial valuation premium, with Series A rounds priced roughly 84% higher than those of their non-AI peers. While the entry-point math has become more demanding, manager selection, pricing discipline, and sector expertise are more important than ever to drive the type of return outcomes our strategy targets.
Expansion Capital Outlook
Public markets remained volatile throughout 2026, creating a more challenging near-term backdrop for expansion capital exits. Legacy software experienced a meaningful re-rating, with the iShares Tech-Software ETF down 15% YTD June 2026 and Salesforce and ServiceNow each declining more than 30%. At the same time, elevated inflation and interest rates have continued to weigh on new IPOs coming to market. With only 15 VC-backed IPOs*completed in Q1, the current pace remains well below what would be needed to clear the multi-year backlog of mature private companies seeking liquidity. The Fed’s decision to hold rates at 3.50% to 3.75% in March, while signaling only one additional 25 basis point cut for the balance of 2026, also extends valuation pressure for later-stage private companies.
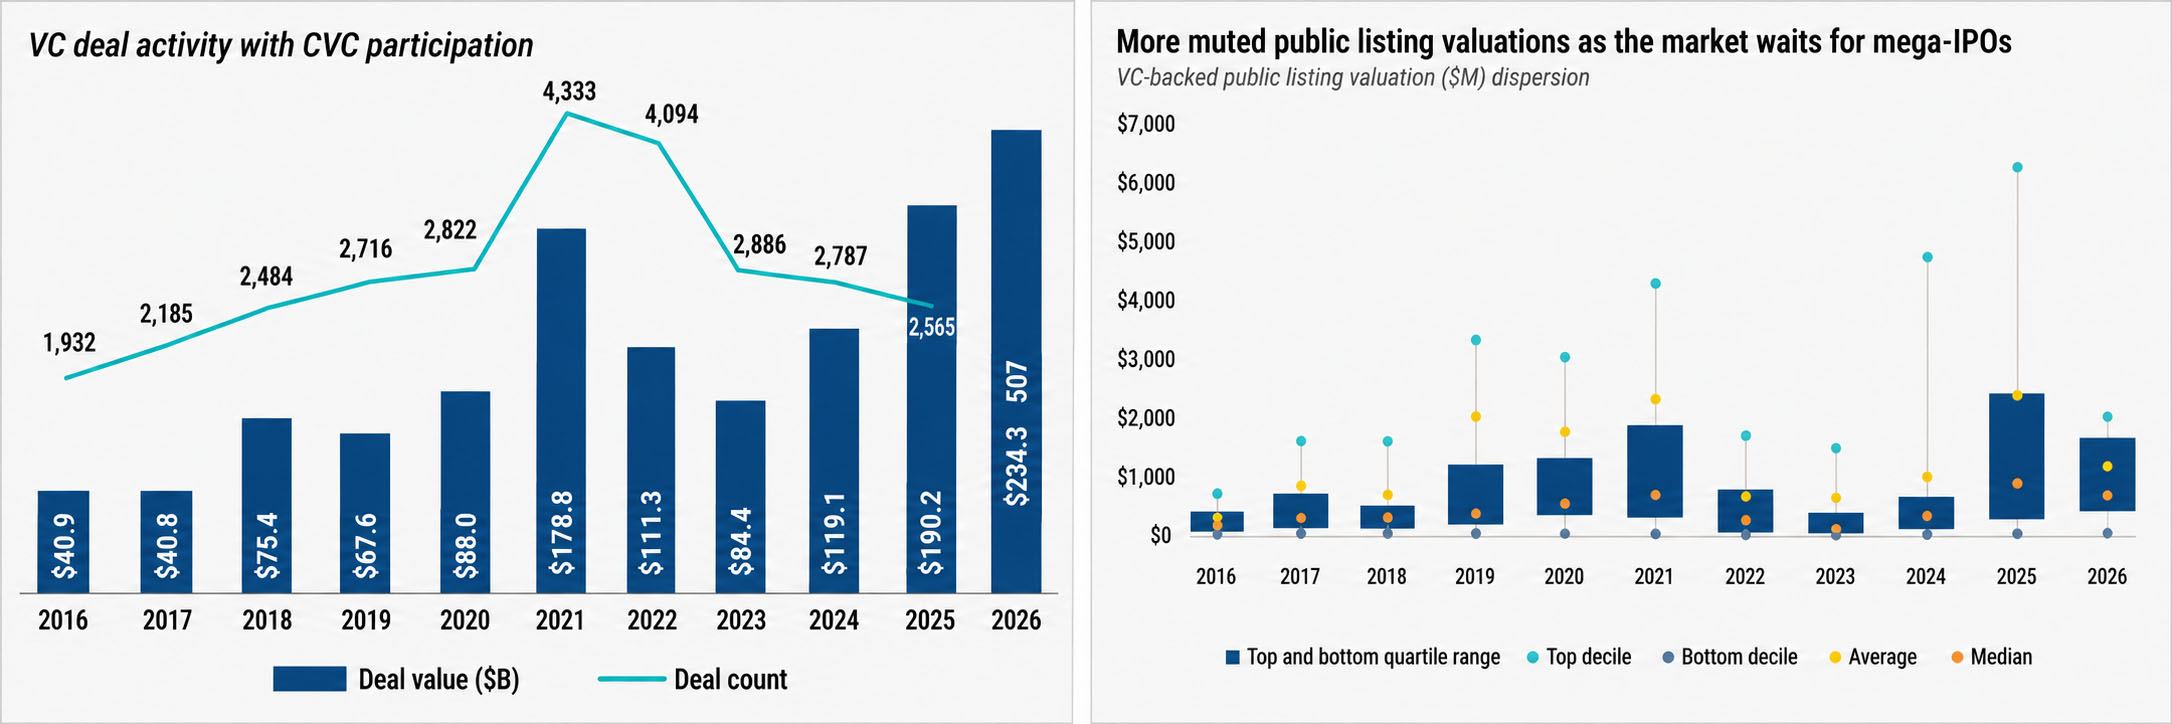
That said, the balance of 2026 may represent an important inflection point for venture-backed liquidity. SpaceX’s public listing has already provided a major proof point for investor demand, while OpenAI and Anthropic are moving toward potential public listings that could further test the depth of the IPO market. If execution and investor appetite hold, these offerings could help reopen the exit market and reset valuation benchmarks for late-stage growth companies. Strategic M&A also remains active at the high end of the market, as demonstrated by Google’s $32 billion acquisition of Wiz, Marvell’s acquisition of Celestial AI, and Palo Alto Networks’ acquisition of Chronosphere. These transactions suggest that strategic buyers remain willing to pay for scarce AI, cybersecurity, observability, and infrastructure capabilities. In parallel, the U.S. venture secondary market reached $106 billion in 2025, underscoring the secondary market’s growing role as a liquidity channel for an asset class that has been a net consumer of LP capital over the past several years.