2025 Outlook Public Equity
Disclaimer: The information and materials prepared are for internal use only and on how the Dancap Family Investment Office (“Dancap”) views current market dynamics. Dancap does not guarantee the accuracy or completeness of the material and it is not intended in any manner to be investment, financial, legal, accounting, tax or other advice and should not be relied upon.
Dancap's Public Equity Markets Outlook
October, 2025
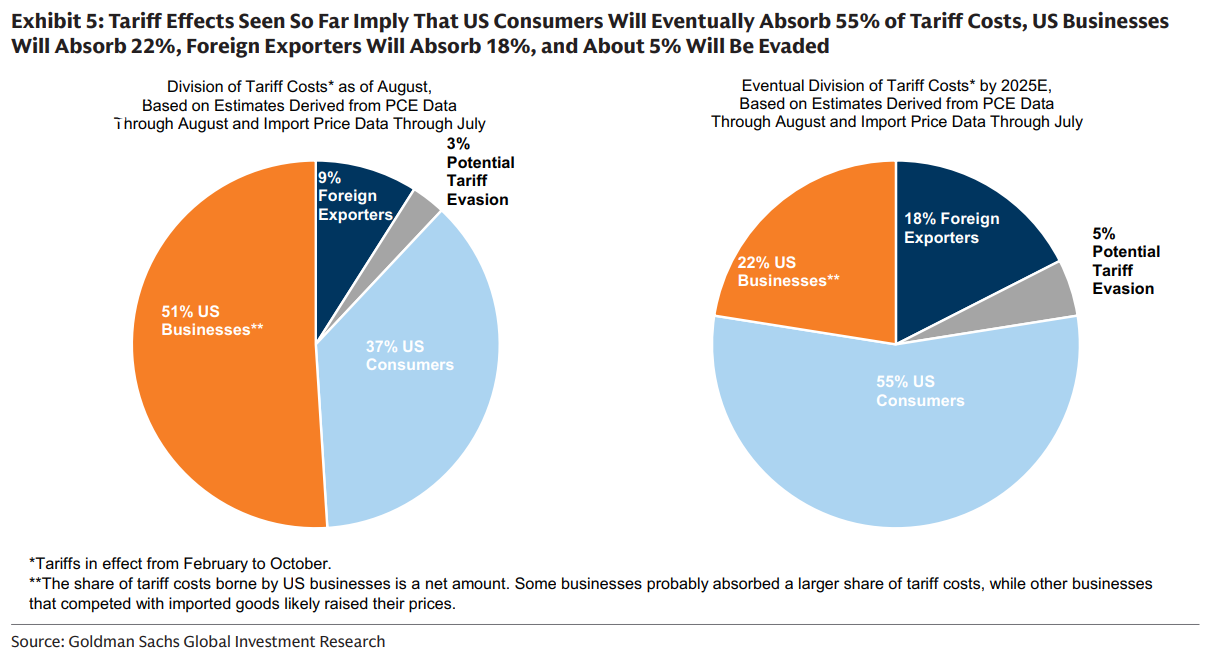
US import tariffs remain a key concern for investors given their potential impact on inflation, interest rates, and consumer demand, and the resulting effect on both S&P 500 valuation multiples and corporate earnings. Goldman Sachs estimates that, as of June 2025, US businesses were absorbing 64% of tariff costs while consumers bore only 22% of the cost. However, this burden is expected to flip by October 2025, with consumers projected to absorb 67% of tariff costs and businesses only 8%, as companies move to offset margin pressure by passing higher costs through to end users. As a result, Goldman forecasts that Personal Consumption Expenditures (PCE inflation will rise to 3.2% year-over-year by December 2025, up from 2.6% at the start of 2025, and still above the Fed’s 2% target.)
US Strategy
The S&P 500 ended the calendar year 2024 with a 23% gain, following a 24% increase in 2023. According to Goldman Sachs, this marked the first time since 1998–1999 that the index achieved back-to-back annual returns exceeding 20%. Of the 23% total return in 2024, 11% was attributed to earnings growth, while 12% resulted from P/E multiple expansion, with valuations rising to 21.9x from 19.5x. The “Magnificent 7” (which represent 35% of the S&P 500’s market capitalization) contributed just over half of the total returns, with NVIDIA alone accounting for 20% of the index’s overall gain. Despite the significant contribution of large-cap technology companies, market breadth in 2024 remained healthy. Goldman Sachs noted that two-thirds of the stocks in the index finished the year with positive returns, and all sectors except Materials—which represents only 2% of the S&P 500’s market cap—posted gains for the year.
Mike Wilson, Chief Equity Strategist at Morgan Stanley, observed that Treasury interest rate sensitivity has reemerged as a key driver for equity markets. In December 2024, the correlation between the 10-year Treasury yield and equity performance turned sharply negative as the Federal Reserve shifted to a less dovish stance, with the 10-year yield surpassing 4.5%. Bloomberg’s consensus forecast anticipates the 10-year Treasury yield will end 2025 at 4.6%. This dynamic is an important consideration for Dancap as it evaluates its public equity holdings in the year ahead.
Source: Goldman Sachs Wealth Management – Investment Strategy Group; August 2025
That said, the U.S. jobs market has started to soften. U.S. nonfarm payrolls rose by just 73k in July and 22k in August, and particularly noteworthy in the July report was the sharp revision down over May and June, with a decrease of 258k taking estimated labor growth from +271k to +33k over the preceding three months. The US Bureau of Labor Statistics released a preliminary report in September trimming job gains estimates by 911k for the 12-month period ending March 2025. This data indicates the labor market is weaker than previously anticipated, albeit still reasonably healthy – job growth still remains positive, unemployment remains low at 4.3%, and average hourly earnings grew 0.3% month-over-month and 3.7% year-over-year as of the end of August.
Goldman expects the cooling labor market to pull PCE inflation back toward 2% by 2028 and in the meantime, give the Federal Reserve the green light to cut interest rates down to 3% by the end of 2026 from 4.25% as of the end of September. Lower interest rates are expected to provide a positive tailwind for both price-to-earnings valuation multiples and corporate earnings. Goldman estimates that every 50bp decline in real 10-year Treasury yields is associated with a roughly 3% increase in the S&P 500 forward P/E, all else equal, and that every 100bp decline in real 10-year Treasury yields could lift corporate earnings by 5%.
US Outlook
Wall Street remains broadly optimistic about the S&P 500’s performance in 2025, with an average year-end price target of 6,539, representing an 11% gain from the December 31, 2024 closing level of 5,882. Analysts anticipate that returns will be primarily driven by earnings growth, with 2025 EPS projected to rise by 7.5%, from $268 in 2025 to $288 in 2026. Additionally, forward price-to-earnings (P/E) multiples are expected to expand modestly by 3% to 22.6x by year-end 2025 from 21.9x. Looking ahead to the first half of 2026, Goldman Sachs’ chief US equity strategist, David Kostin, believes that the S&P 500 could reach 6,900 by June 30, 2026 (+11% return over the prior 12 month period), based on a forward earnings per share (EPS) of $313 and a forward P/E multiple of 22.4x
Wall Street’s Year-End 2025 S&P 500 Forecasts
| as of December 31, 2024, the S&P 500 finished the year at 5,882 equal to a next 12 months EPS forecast of $268 per share and a forward P/E multiple of 21.9x | YE 2025 S&P 500 Price Target (implied % change for 2025) | 2025 EPS Forecast (implied growth from 2024 EPS of $238) |
| Average Bloomberg Estimate across 20 banks; select major banks listed below | 6,512 (+11%) | $266 (+11%) |
| Bank of Montreal | 6,700 (+14%) | $275 (+15%) |
| Barclays | 6,450 (+10%) | $268 (+13%) |
| Citi Bank | 6,600 (+12%) | $272 (+14%) |
| Goldman Sachs GIR (Global Investment Research); David Kostin – Chief US Equity Strategist | 6,800 (+16%) | $262 (+10%) |
| Goldman Sachs ISG (Investment Strategy Group); Brett Nelson – Head of Tactical AA, ISG Group | 6,250 (+6%) | $267 (+12%) |
| Morgan Stanley | 6,500 (+11%) | $271 (+14%) |
| Royal Bank of Canada | 6,350 (+8%) | $269 (+13%) |
| UBS | 6,100 (+4%) | $260 (+9%) |
| Wells Fargo | 6,650 (+13%) | $270 (+13%) |
A correction in US equities remains a key risk, potentially driven by a reversal in enthusiasm around artificial intelligence. Since Liberation Day (April 1, 2025), as of October 15, the S&P 500 has rallied 34%, representing one of the strongest non-recession rallies in the past two decades. However, market leadership has narrowed materially. While the index sits at record highs, the median stock is more than 10 percent below its 52-week peak, pushing market breadth to its weakest level since 2023. Much of the upside has been concentrated in the “Magnificent 7,” with AI-driven momentum powering gains. Goldman Sachs notes that the top 10 stocks by market cap now account for 38% of the S&P 500 market capitalization, the highest concentration since 1972. This raises the risk that any potential reversal in AI sentiment could trigger a broader stock market correction. Historically, sharp declines in market breadth have preceded below average equity returns and larger than normal pullbacks.
European Outlook
The STOXX Europe 600 index is up 11% year-to-date as of October 15, 2025, supported by moderate earnings growth and multiple expansion. Goldman Sachs Research believes European equities still have room to advance and could return another 6% by March 2026.
Recent earnings growth has been driven in part by Germany’s proposals for expansionary fiscal policy, including higher spending on infrastructure and defense, which bypass the restrictions of the constitutional debt brake. This represents a significant change for Germany and for Europe, which has historically been reluctant to use government spending as a growth lever. In addition, the new trade deal between Europe and the United States has provided investors with more predictability and reduced concerns about future uncertainty in the region.
Valuation expansion has also been supported by monetary policy. The European Central Bank (ECB) has already cut interest rates by 100 bps this year, lowering its policy rate to 2.15% from 3.15%. With fiscal spending on the rise and inflationary pressures less of a concern in Europe than in the U.S., the environment has been favorable for equities. That said, the ECB is likely near the end of its rate-cutting cycle, with markets currently pricing in only up to one more 25 bps rate cut by the end of 2026.
European public equities continue to trade at roughly a 35% discount to U.S. equities on a price-to-earnings (P/E) multiple basis, above the historical average discount of 28%. The valuation gap is largely explained by structural differences in market composition. The U.S. is heavily weighted toward high-growth sectors such as technology, which command higher P/E multiples, while Europe has greater exposure to traditional, lower-growth sectors such as energy and financials. These differences help explain why the discount persists, and while sector mix adjustments can narrow the gap, they are unlikely to eliminate it entirely. As a result, the current spread represents a compelling relative value opportunity in European equities.
To see the Dancap Public Equity Investment Criteria and Portfolio, please click here.